


Chart is an analytical basic trader tool on Forex. The price it is possible to describe graphically in different configurations. Bar and candlestick line charts are included in the most popular types of charts. In the article their broad elaboration was presented.

Copyright : Sinisa Botas / 123RF Stock Photo
Line charts are a base for trend analysis
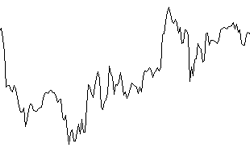
Line charts present a summary of closing prices in selected investment vehicle. Thanks to them in a flash you will recognize a dominant trend on the market. Linear character arouses positive associations, as regard to analysis transparency. Limited scope of data causes that it isn’t possible to regard line charts as an optimal observation format of the currency market. By applying only a line chart you can’t see the full price activity. In technical analysis you will find a lot of formations dedicated to line charts only, e.g. triangles, double or triple peaks. They are appropriate to read geometrical patterns.
Bars chart as a step towards graphical perfection of Forex analysis
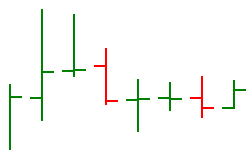
Bar charts are a first phase of the line charts evolution. Opening and closing prices already distinguish in them, along with minimal and maximum price fluctuations. Therefore, one bar presents an overall picture of the market activity in assumed horizon range. On the left side of bar chart you can see an opening price, and on the right closing. Forex brokers install modules in the investment platforms, which enables a change of bar colors, downward and upward, so that the profiteer could more easily forecast market movements. Bar chart definitely loses the fight against candlestick chart.
Candlestick charts are a perfect graphical reflection of the market
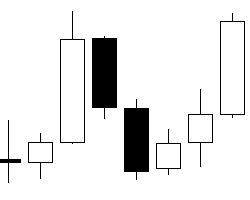
Japanese used candlestick charts already in 18th century, while trading the rice. In United States and Europe the Japanese candles were used from 90s. Now without a doubt they became the most popular format of monitoring changes in prices, since graphical perfection of data presentation distinguishes them. In Japanese candles a body, which constitutes difference between opening and closing price, creates its image. If the body is black, then you deal with bear market (downward), and if the body is white you deal with bull market (upward). The body leave so-called shadows, i.e. maximum and minimal price of the day. Discussed above charts merges into one whole, in addition not carrying short-term prognostic value. However, candlestick charts enable to make decisions already based on one “candle”. Interpretation of the formation is much simpler, thanks to graphical precision. Candlestick charts overtake other technical indicators. Moreover, they allow in a flash to discover the most important emotions.
Charts underwent evolution over the investing years
It is worthwhile to add that line charts constitute a basic form of change observations in prices over time, and candlestick charts are the most advanced model, created in the evolution of analytical techniques.
Note above time frame
In above cases the timeline and price-line are always needed to build a chart. On Forex it is possible to conduct analysis from a few minutes to monthly charts. Therefore, bars may be subject to dynamic conversions (short horizon of analysis) or free (long horizon of analysis).
An effectiveness of prognostic process is conditional above the choice of chart. Japanese candles are ideal graphical presentation of the market. However, when you find on them a certain formation, before taking final decision, it is worthwhile to look for confirmation in the rest of charts and indicators. Chart conversion, e.g. candlestick on linear completely changes the observation scope; therefore at the beginning of adventure with currency market you should select the best visual representation for yourself.


